There is a divergent landscape in America in regard to the Affordability Crisis. As a Clinical Laboratory Scientist (Medical Technologist) I have the opportunity to meet with many colleagues from across the county and the conversations regarding affordability are starkly different from one region to another.
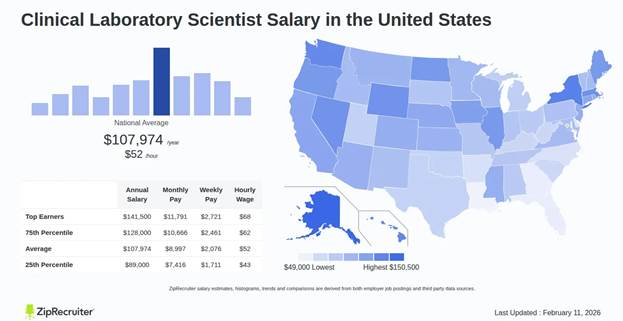
I took the basic mean salary data from ZipRecruiter and calculated and annual Full Time salary (based on 2080 Hours) – pay may be different based on localities and shift differentials, but the mean is a fair measure. Then used that base salary and applied it to the Zillow website's Affordability Calculator to see how much home one could afford with the average salary earned in that state.
Figure 1. Salary Heat Map (USA)
I then compared the Median Home price for the State (From Forbes) to what a Full Time Clinical Laboratory Scientist could afford. The results vary from state to state.
There were only five states that had a reasonable affordability index where a Clinical Laboratory Scientist could own their own (Median Priced) home on their salary alone. Oklahoma was by far the biggest winner, where you could afford the median home and actually afford one $34,000 above the median price. Next was Ohio at + $25k.
The other three that were really close to the median were North Dakota, Iowa and my home state of Michigan. We really do enjoy a great quality of life in Michigan, we have a diverse economy and many naturally beautiful landscapes. (If you follow Josh & Jase on TicTok or YouTube, they were just here.) We have four seasons (Must like snow), lakes, forests and the quality of life is high. We also have some outstanding Health Care providers including: Corewell Health (formerly Beaumont/Spectrum), University of Michigan Health, Trinity Health Michigan, and Henry Ford Health.
The rest of the states would require two equivalent salaries to be able to afford a Median Home – Except for three localities: District of Columbia, Hawaii and California. Those are insurmountable outliers for most people
Figure 2. Average Hourly Salary by State with Median Home price and home Affordability by Salary.
|
State
|
Hourly Rate (Zip Recruiter)
|
2080 hours (FullTiime)
|
Median Home Price (Forbes)
|
Affordability Calculator (Zillow)
|
Difference Between Median Home price and Affordability
|
|
Dist. of Columbia
|
$58.68
|
$122,054.40
|
$1,360,000
|
$409,216
|
($950,784)
|
|
California
|
$54.65
|
$113,672.00
|
$906,500
|
$379,526
|
($526,974)
|
|
Massachusetts
|
$53.38
|
$111,030.40
|
$702,400
|
$370,138
|
($332,262)
|
|
New York
|
$52.43
|
$109,054.40
|
$586,400
|
$369,428
|
($216,972)
|
|
Alaska
|
$52.14
|
$108,451.20
|
$422,600
|
$369,021
|
($53,579)
|
|
Washington
|
$50.61
|
$105,268.80
|
$690,100
|
$357,497
|
($332,603)
|
|
Hawaii
|
$49.71
|
$103,396.80
|
$957,800
|
$350,720
|
($607,080)
|
|
Connecticut
|
$48.63
|
$101,150.40
|
$523,600
|
$342,588
|
($181,012)
|
|
New Jersey
|
$46.97
|
$97,697.60
|
$575,000
|
$330,087
|
($244,913)
|
|
Oregon
|
$46.85
|
$97,448.00
|
$543,600
|
$329,182
|
($214,418)
|
|
Nevada
|
$46.72
|
$97,177.60
|
$500,700
|
$328,205
|
($172,495)
|
|
Florida
|
$45.93
|
$95,534.40
|
$436,600
|
$322,256
|
($114,344)
|
|
Colorado
|
$45.16
|
$93,932.80
|
$671,100
|
$312,836
|
($358,264)
|
|
Virginia
|
$45.10
|
$93,808.00
|
$499,400
|
$316,007
|
($183,393)
|
|
Rhode Island
|
$44.27
|
$92,081.60
|
$528,600
|
$309,755
|
($218,845)
|
|
Arizona
|
$44.00
|
$91,520.00
|
$466,500
|
$307,724
|
($158,776)
|
|
Minnesota
|
$43.95
|
$91,416.00
|
$389,300
|
$307,347
|
($81,953)
|
|
Ohio
|
$43.25
|
$89,960.00
|
$276,900
|
$302,076
|
$25,176
|
|
New Hampshire
|
$42.77
|
$88,961.60
|
$541,400
|
$298,459
|
($242,941)
|
|
Illinois
|
$42.60
|
$88,608.00
|
$322,700
|
$297,181
|
($25,519)
|
|
Maryland
|
$42.34
|
$88,067.20
|
$552,300
|
$295,223
|
($257,077)
|
|
Oklahoma
|
$42.23
|
$87,838.40
|
$260,400
|
$294,394
|
$33,994
|
|
Delaware
|
$41.95
|
$87,256.00
|
$392,200
|
$292,286
|
($99,914)
|
|
Texas
|
$41.27
|
$85,841.60
|
$353,700
|
$287,164
|
($66,536)
|
|
Pennsylvania
|
$41.21
|
$85,716.80
|
$340,200
|
$286,711
|
($53,489)
|
|
North Dakota
|
$40.49
|
$84,219.20
|
$276,906
|
$281,291
|
$4,385
|
|
Vermont
|
$39.87
|
$82,929.60
|
$459,400
|
$276,621
|
($182,779)
|
|
Michigan
|
$40.81
|
$84,884.80
|
$290,200
|
$283,699
|
($6,501)
|
|
Wisconsin
|
$39.08
|
$81,286.40
|
$350,000
|
$270,709
|
($79,291)
|
|
Utah
|
$38.51
|
$80,100.80
|
$636,400
|
$266,379
|
($370,021)
|
|
Montana
|
$38.27
|
$79,601.60
|
$538,300
|
$264,572
|
($273,728)
|
|
North Carolina
|
$38.16
|
$79,372.80
|
$403,700
|
$263,743
|
($139,957)
|
|
Wyoming
|
$36.65
|
$76,232.00
|
$354,000
|
$252,375
|
($101,625)
|
|
Nebraska
|
$36.45
|
$75,816.00
|
$314,800
|
$250,869
|
($63,931)
|
|
Maine
|
$36.26
|
$75,420.80
|
$396,400
|
$249,435
|
($146,965)
|
|
Georgia
|
$36.19
|
$75,275.20
|
$398,400
|
$248,910
|
($149,490)
|
|
Missouri
|
$35.81
|
$74,484.80
|
$291,200
|
$246,047
|
($45,153)
|
|
Indiana
|
$35.74
|
$74,339.20
|
$279,300
|
$245,522
|
($33,778)
|
|
Iowa
|
$35.43
|
$73,694.40
|
$255,200
|
$243,187
|
($12,013)
|
|
South Carolina
|
$35.40
|
$73,632.00
|
$410,100
|
$244,157
|
($165,943)
|
|
Idaho
|
$35.25
|
$73,320.00
|
$505,300
|
$241,832
|
($263,468)
|
|
Kansas
|
$35.18
|
$73,174.40
|
$311,500
|
$241,304
|
($70,196)
|
|
Tennessee
|
$34.72
|
$72,217.60
|
$412,600
|
$237,839
|
($174,761)
|
|
Alabama
|
$34.12
|
$70,969.60
|
$295,500
|
$233,321
|
($62,179)
|
|
New Mexico
|
$34.11
|
$70,948.80
|
$353,400
|
$233,245
|
($120,155)
|
|
Kentucky
|
$33.38
|
$69,430.40
|
$282,800
|
$227,749
|
($55,051)
|
|
South Dakota
|
$33.15
|
$68,952.00
|
$344,700
|
$226,019
|
($118,681)
|
|
Louisiana
|
$32.21
|
$66,996.80
|
$263,200
|
$218,937
|
($44,263)
|
|
West Virginia
|
$31.25
|
$65,000.00
|
$253,100
|
$211,711
|
($41,389)
|
|
Arkansas
|
$31.05
|
$64,584.00
|
$270,200
|
$210,205
|
($59,995)
|
|
Mississippi
|
$29.08
|
$60,486.40
|
$264,900
|
$195,368
|
($69,532)
|
| |
|
|
|
|
|
|
Licensure States
|
|
|
|
|
|
In the Data above, I highlighted the states that have a Licensure Requirement for Clinical Laboratory Scientists. As there are only 10 states that have this requirement, there is no real way to correlate the impact of Licensure on salaries or affordability. Other than the impact of the New Licensing Fees enacted by California that are now $300.00/year to be able to work - where most states do not charge Clinical Laboratory Scientist personnel to engage in their profession.
The bottom line is if your quality of life score includes home ownership – consider the Midwest where your skills stretch further.. What about your experiences? Feel free to post a response regarding how housing feels on a MLS salary. Drop a comment, happy to share.
Dave Haagsma MLS(ASCP)CM,MBA
Medical Laboratory Scientist Salaries vs Home Affordability - a State by State Analysis.
| Medicus-health |
remove preview |
|
| Medical Laboratory Scientist Salaries vs Home Affordability - a State by State Analysis. |
| There is a divergent landscape in America in regard to the Affordability Crisis. As a Clinical Laboratory Scientist (Medical Technologist) I have the opportunity to meet with many colleagues from across the county and the conversations regarding affordability are starkly different from one region to another. |
| View this on Medicus-health > |
|
|
------------------------------
David Haagsma Med Lab Scientist/Med Technologist(non-supervisor)
Byron Center MI
(616)272-6007
------------------------------